
- PostgreSQL
- Observability
- Latency
The p99 that was a cron job
For three weeks one endpoint’s p99 went to nine seconds every night at 02:10 and recovered on its own by 02:40. Nobody was awake to see it and the dashboard averaged it away. The fix was one word of SQL; the finding was the three weeks.
3 мин. читање
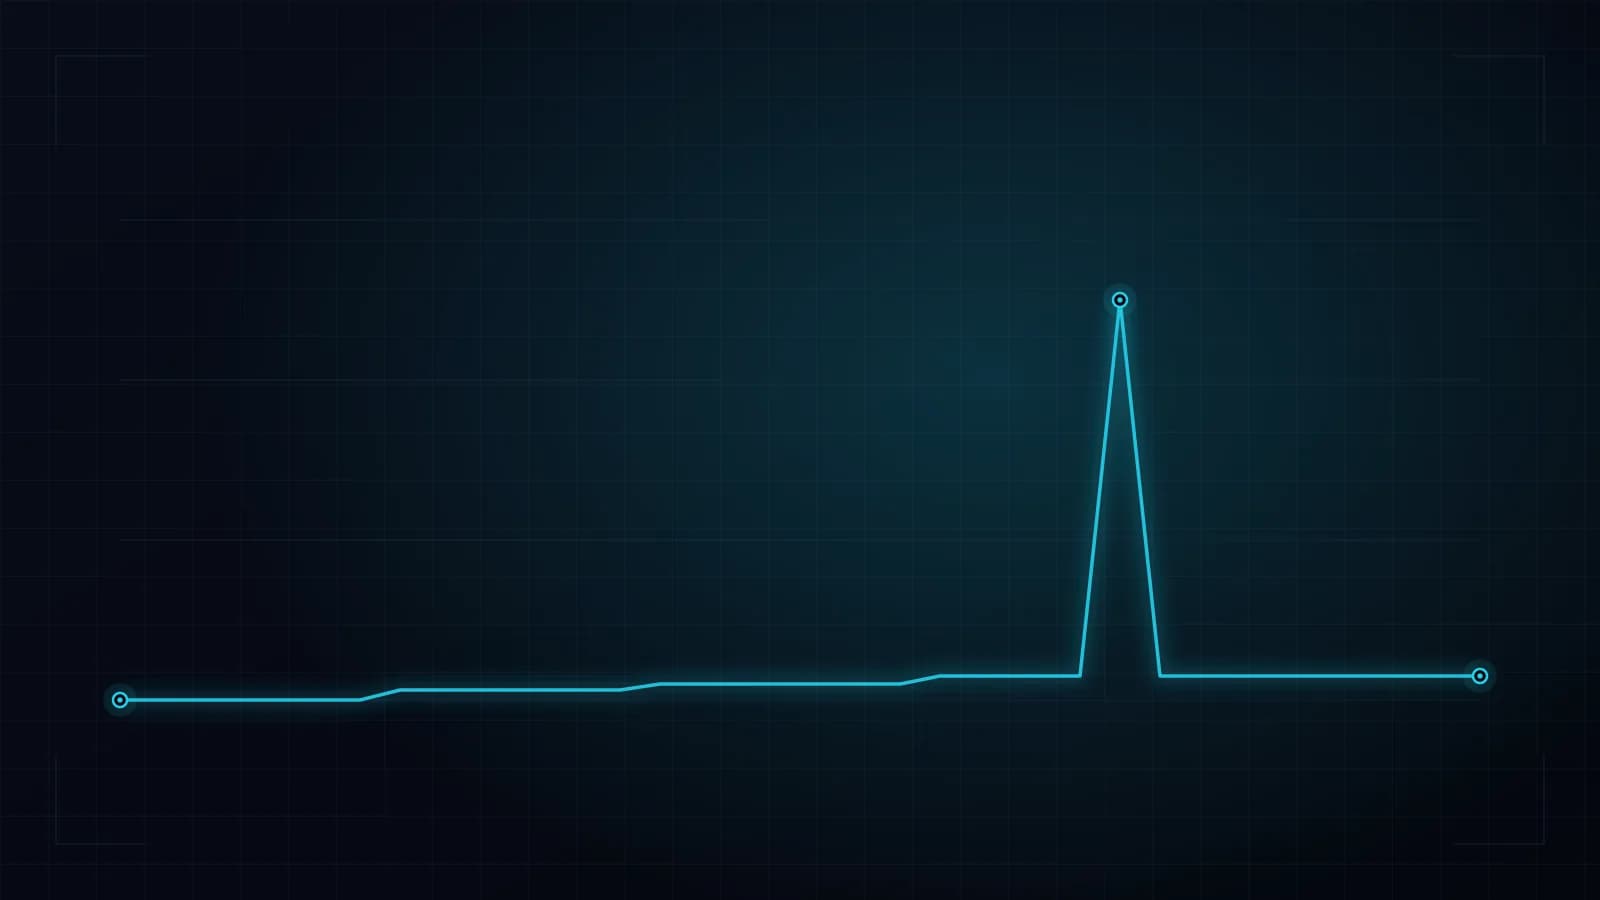
The alert was never loud enough to wake anybody. A single endpoint — the one the mobile app calls on launch — went from a 180 ms p99 to about nine seconds, every night, and was back to normal before anyone in Tehran had breakfast. It did this for three weeks.
First mistake
The dashboard was averaging it away
Our latency panel was a one-hour rolling mean. Thirty minutes of nine-second responses inside a day of 180 ms responses moves a daily mean by a few milliseconds. It moves the p99 by nine seconds. We had the percentile in the metrics store the whole time; the panel simply did not draw it.
The first change was not a fix. It was replacing every mean on that board with p50, p95 and p99 on the same axis, so a tail that separates from the median is visible as a shape rather than as a number somebody has to compare against memory.
What it was
A nightly job holding a lock it did not need
At 02:10 a job rebuilt a materialised view used by the app-launch query. It ran REFRESH MATERIALIZED VIEW without CONCURRENTLY, which takes an ACCESS EXCLUSIVE lock — and every read of that view queues behind it. The refresh took about half an hour because the view had grown by a factor of forty since the day it was written.
The job was two years old. It had been correct on the day it was written and had been quietly wrong ever since the table it read got big.
-- before: takes ACCESS EXCLUSIVE, every reader queues behind it
REFRESH MATERIALIZED VIEW app_launch_summary;

-- after: readers keep the previous snapshot while the new one builds.
-- needs a UNIQUE index on the view, which is the whole cost of the fix.
REFRESH MATERIALIZED VIEW CONCURRENTLY app_launch_summary;
9.2s
p99 during the refresh
before
190ms
p99 during the refresh
after
21
days it went unnoticed
the actual finding
Measured on the same endpoint, the same query, a week either side of the change.
Percentiles on every latency panel, never means
A mean cannot show you a tail. That is not a preference, it is what a mean is for.
Alert on the p99 of the hour, not on the p99 of the day
A window wide enough to smooth the incident is a window that will not page anyone.
Every scheduled job carries the lock it takes in its name or its comment
Not documentation. The one line the next person reads at 02:00 with no context.
Уште за читање
- Vector Search
- Retrieval
Vector retrieval in production: when a vector database earns its cost
A vector database is an architectural decision, not an automatic upgrade to search. If you can't name exactly what you're missing from plain text search, you probably don't need o…
8 мин. читање
- API Design
- Type Safety
Typed contracts between backend and client: why shared schemas cut integration bugs
"It worked in Postman" is a sentence nearly every team has said at least once, right before discovering the real problem was somewhere else. A typed contract between backend and c…
9 мин. читање
- Trust
- News Systems
Scoring news trustworthiness: designing a system that doesn't claim to be neutral
A trust label is an editorial decision encoded in software, not a measurement. Every design choice downstream of that fact — from data model to what you show the reader — depends…
9 мин. читање
Имате нешто за градење?
Кажете ни на што работите. Искрено ќе ви кажеме дали сме вистинскиот тим за тоа.
или пишете ни на hello@larsima.com